The latest water quality report is now available. The testing was conducted by our partners at Equiox Environmental, and looks at the following metrics: Water Transparency, Turbidity, Lake Trophic States, Nutrient Levels, Conductivity, and Algae Populations.
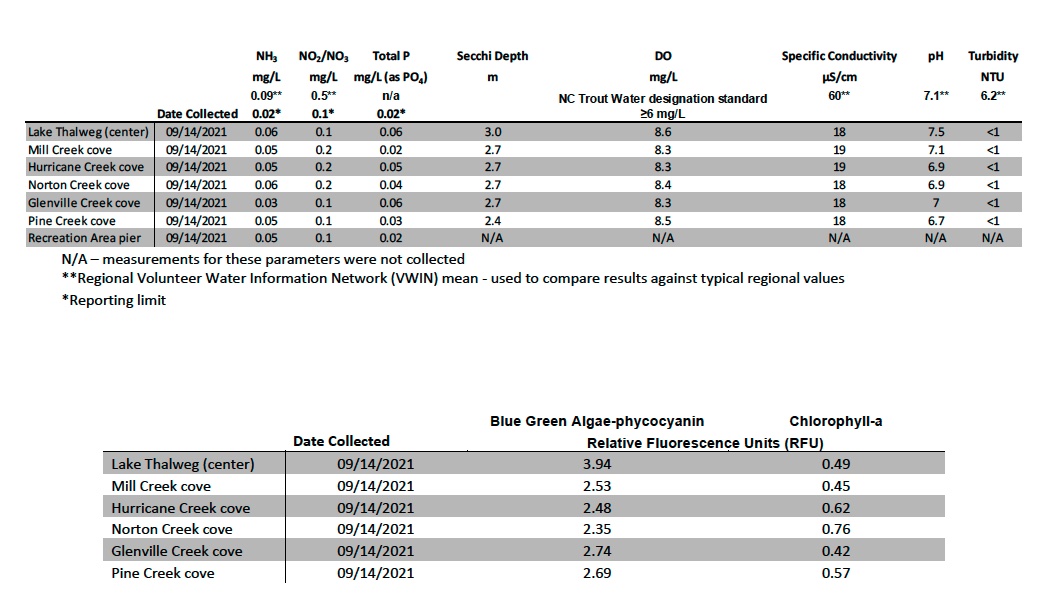
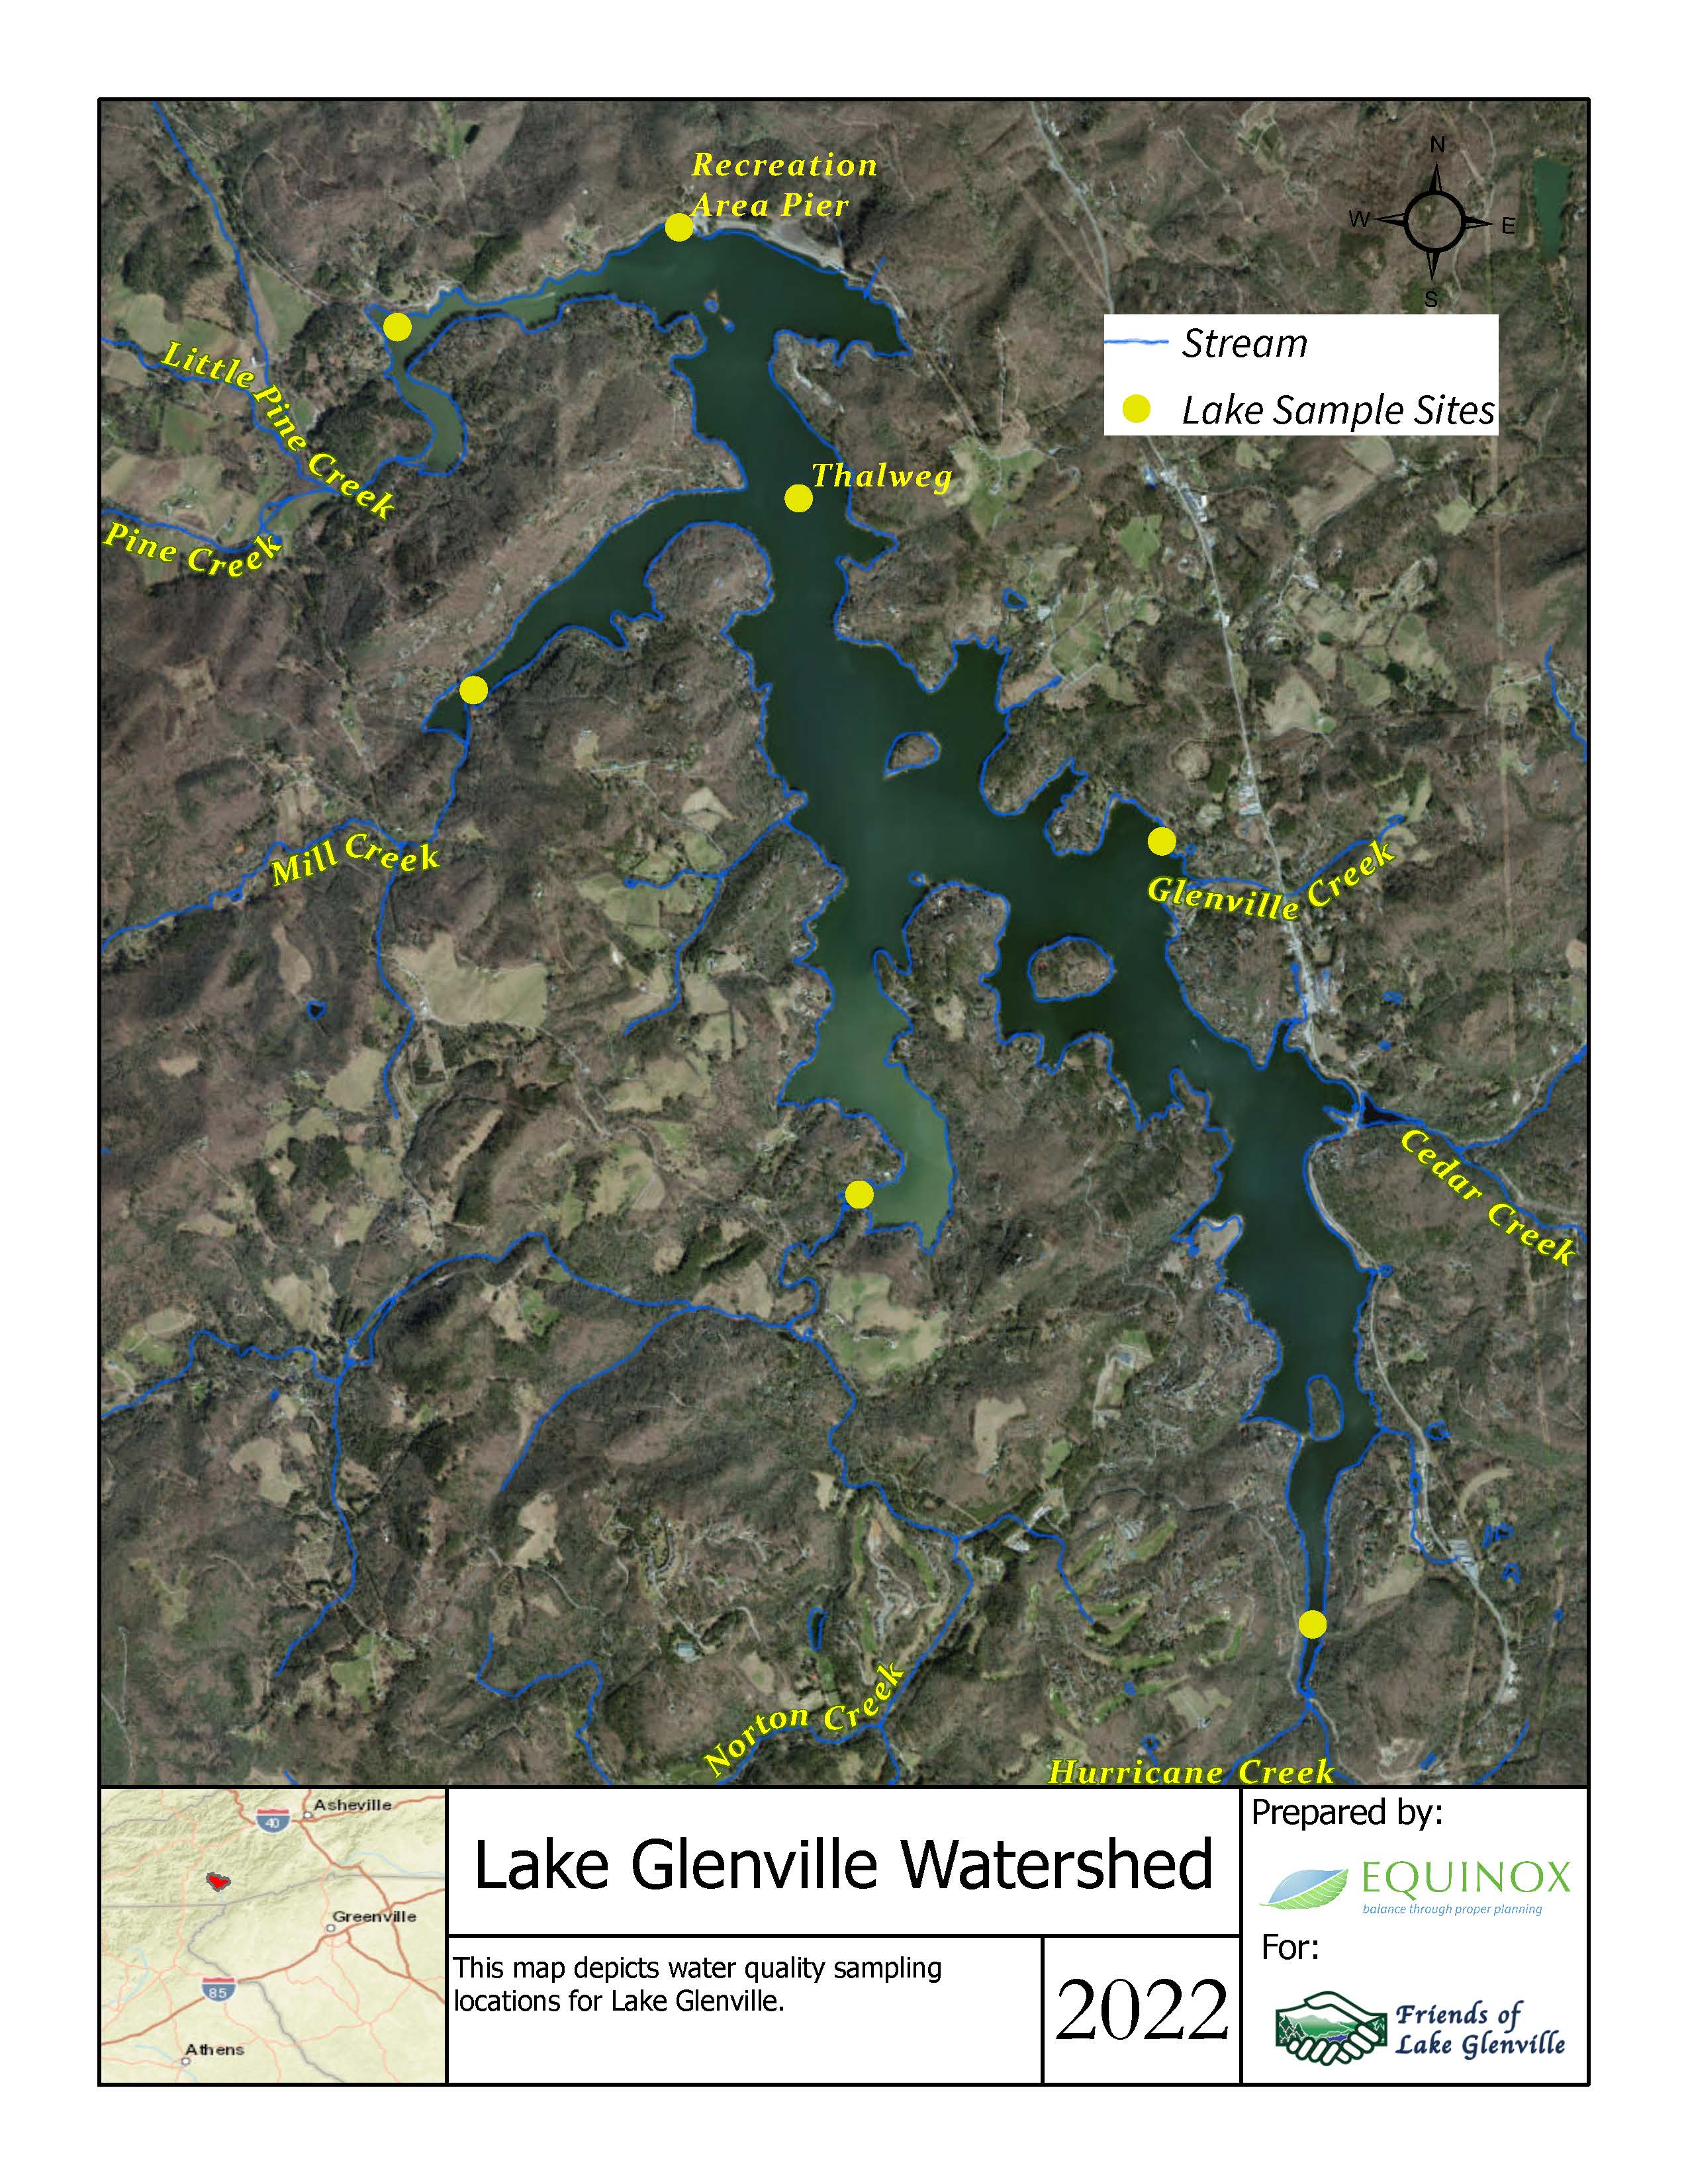
Water quality samples were collected from Lake Glenville at seven (7) locations. Five of the locations are in coves near the outlet of major streams within the watershed: Mill Creek, Hurricane Creek, Norton Creek, Glenville Creek, and Pine Creek. These creeks are also routinely sampled for a suite of water quality parameters, increasing the knowledge and understanding of the specific issues of the watershed such as identifying potential sources of pollutants which may be degrading water quality. Samples were analyzed for water temperature, dissolved oxygen (DO), pH, specific conductivity, turbidity, Ammonia-Nitrogen (NH3 +), Nitrate/Nitrite-Nitrogen (NO3 -/NO2 -), Total Phosphorus (TP), blue green algae-phycocyanin, and Chlorophyll-a. All water quality samples collected for analysis of Phosphorous and Nitrogen were collected from the upper two (2) meters of the lake using a depth integrated water sampler. Other parameters were measured using an In-Situ Aqua Troll 600 multiparameter sonde.
Read on or download the full report below.
Water Transparency
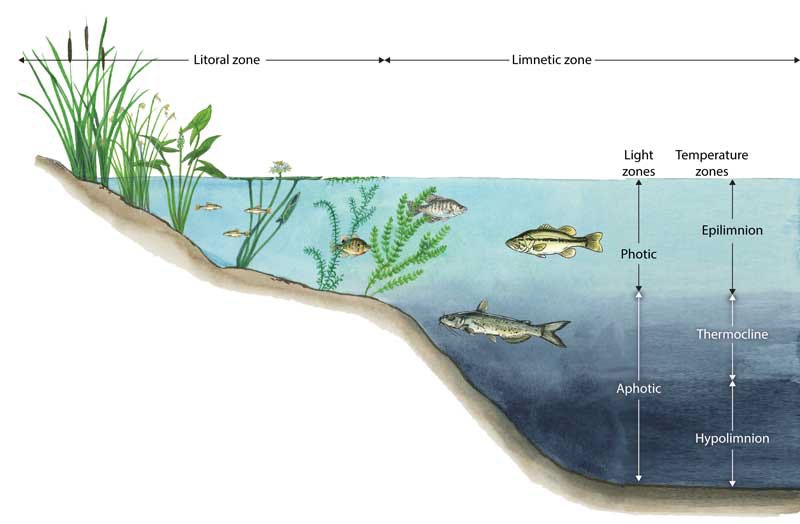
Transparency is how easily light can pass through a substance. In lakes this means how deep sunlight penetrates through the water. Plants and algae need sunlight to grow, so they are only able to grow in areas of lakes where the sun penetrates. The top section of the lake that sunlight penetrates is called the photic zone. The area around the edge of the lake that is shallow enough for plants to receive light is called the littoral zone. Adjacent to the littoral zone is the limnetic zone. The limnetic zone is oxygenated by mixing and photosynthesis. The area of the lake that is too deep for plants to grow is called the aphotic zone.
Water transparency depends on the number of particles in the water. These particles can be algae or sediment from erosion, the more particles – the less water transparency. In other words, when the water is murky or cloudy and contains a lot of particles, the light cannot penetrate as deeply into the water column.
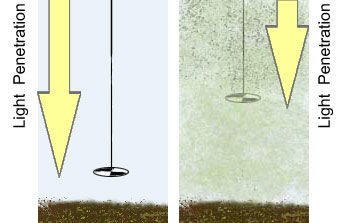
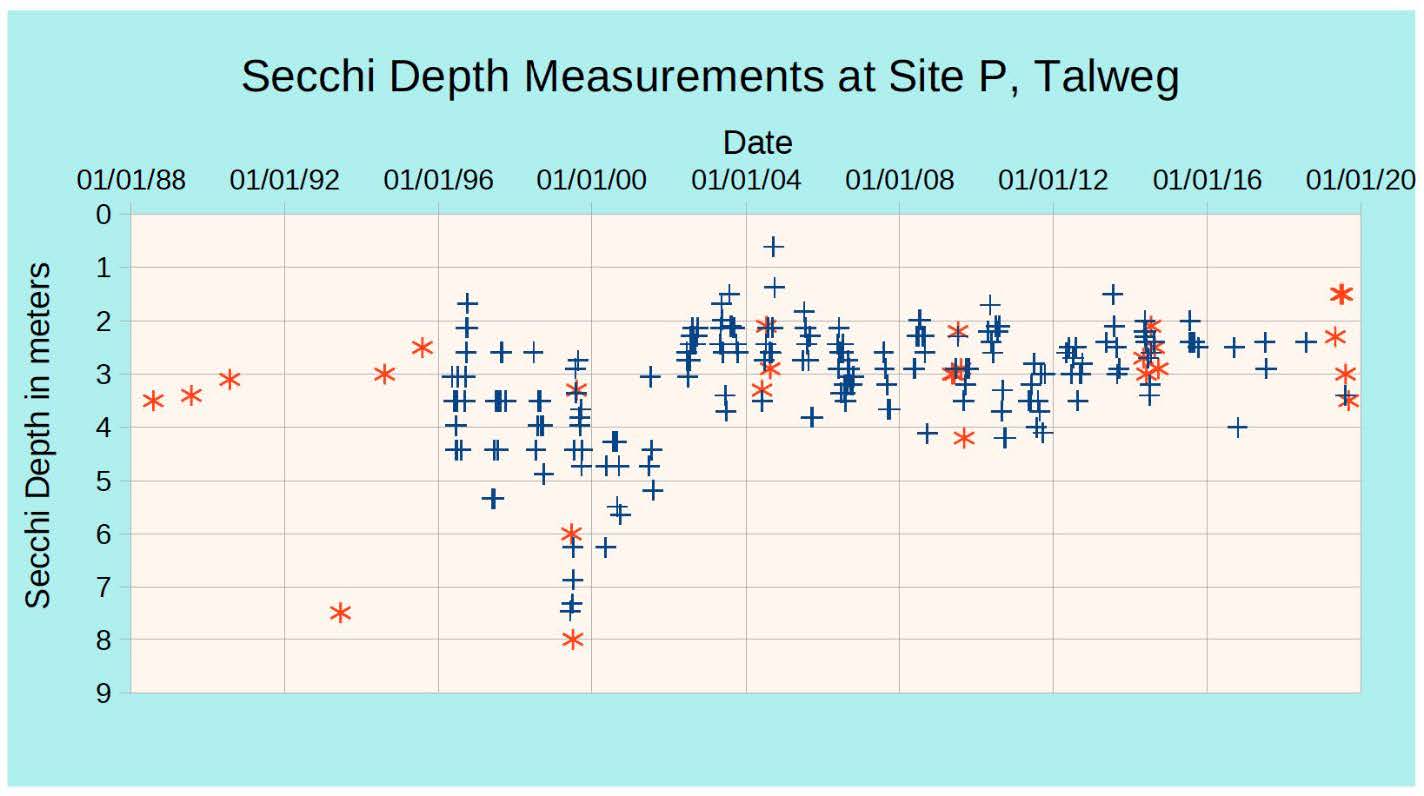
Water transparency is measured with a Secchi disk. A Secchi disk is a metal disk, 8 inches in diameter that is lowered into the water on a cord. The depth that the Secchi disk can no longer be seen through the water is the Secchi depth. When the water transparency is high, the Secchi depth is high. When the water transparency is low and cloudy, the Secchi depth is low. Conclusions about the trophic state of a lake can be drawn by measuring the Secchi depth since water transparency is directly related to Total Phosphorous and Chlorophyll-a.
Lake Glenville has a long record of Secchi depth measurements dating back to 1988, as illustrated in the figure below. The September 2021 measurement at the Thalweg site was 3 meters, which is consistent with the historical average Secchi depth for the site. Secchi depths at other sites ranged from 2.4 m to 2.7 m.
Turbidity
Turbidity is a measurement of the visual clarity of a water sample and indicates the presence of fine suspended particulate matter. The unit used to measure turbidity is NTU (nephelometric turbidity units), which measures the absorption and reflection of light when it is passed through a sample of water. Because particles can have a wide variety of sizes, shapes and densities, there is only an approximate relationship between the turbidity of a sample and the concentration (i.e. weight) of the particulate matter present.
Mountain streams in undisturbed forested areas remain clear even after a moderately heavy rainfall event, but streams in areas with disturbed soil may become highly turbid after even a relatively light rainfall. Deposition of silt into a stream bottom can bury the complex bottom habitat. Consequently, the habitat for most species of aquatic insects, snails, and crustaceans is destroyed by stream siltation. The absence of these species reduces the diversity of the ecosystem.
The standard for trout designated waters is 10 NTU while the standard to protect other aquatic life is 50 NTU. The VWIN regional average median for turbidity is 5.2 NTU, and the pristine average median is 1.6 NTU.
Turbidity of the water samples collected at Lake Glenville were all less than 1 NTU on 9/14/2021.
Lake Trophic States
Scientists like to classify lakes and give names to the different lake types so they can be easily referred to. Trophic states are based on lake fertility. The root “trophy” means nutrients; therefore, lakes are classified based on the amount of available nutrients (Phosphorus and Nitrogen) for organisms. More fertile lakes have more nutrients and therefore more plants and algae. Lake Glenville was formed when Thorpe Dam was built in 1941. In this relatively newly formed lake, the edges and bottom are primarily exposed rock, which does not erode very quickly, meaning there are few nutrients available. As the lake ages, sediment from the watershed is washed in, filling in the bottom of the lake. This sediment is rich in nutrients, and therefore also increases the fertility of the lake.
It is important to remember that lake trophic state is not interchangeable with water quality.
Lake Glenville’s trophic state is oligotrophic.
What Is Oligotrophic?
The prefix “Oligo” means very little; therefore, oligotrophic means very little nutrients (Phosphorus and Nitrogen). Oligotrophic lakes are usually found in colder climates and have deep clear water, rocky and sandy bottoms, and very little algae. The fish found in oligotrophic lakes like cold, highly oxygenated water, examples include trout and smallmouth bass.
In oligotrophic lakes, oxygen is found at high levels throughout the water column. Cold water can hold more dissolved oxygen than warm water, and the deep region of oligotrophic lakes stays very cold. In addition, low algal concentration allows deeper light penetration and less decomposition. When algae, zooplankton, and fish die, they sink to the bottom and are decomposed by microbes and invertebrates. This decomposition process uses up oxygen. Since oligotrophic lakes are less fertile and have less algae and other organisms, there is less decomposition and the oxygen doesn’t get used up.
Phosphorous
Phosphorus is a nutrient important for plant growth. In most lakes, including Lake Glenville, phosphorus is the limiting nutrient, which means that everything that plants and algae need to grow is available in excess (sunlight, warmth, water, nitrogen, etc.) except phosphorus. This means that phosphorus has a direct effect on plant and algal growth in lakes – the more phosphorus is available, the more plants and algae there are in the lake. Phosphorus originates from a variety of sources, many of which are related to human activities. Major sources include human and animal wastes, soil erosion, detergents, septic systems and runoff from farmland or fertilized lawns.
Phosphorus is usually measured in two ways in lakes, ortho-phosphate (soluble reactive phosphorus) and total phosphorus. Orthophosphate is the chemically active dissolved form of phosphorus that is taken up directly by plants. Orthophosphate levels fluctuate daily, and in lakes there usually isn’t a lot of orthophosphate because it is incorporated into plants quickly. Total phosphorus (TP) is a better way to measure phosphorus in lakes because it includes both ortho-phosphate and the phosphorus in plant and animal fragments suspended in lake water. TP levels are more stable, and an annual mean can tell you a lot about the lake’s water quality and trophic state.
Another way that phosphorus can enter lakes is from the sediment at the bottom of the lake. When the bottom of a lake is anoxic (usually in late summer and late winter), chemical processes at the sediment/water interface cause phosphorus to be released from the sediments. This phenomenon is called internal loading because the phosphorus is coming from within the lake (from the sediment). When the lake mixes again, this increased phosphorus fuels algae growth.
There is no legal water quality standard, but generally phosphorus (P) levels must be below 0.05 mg/L to prevent eutrophication. The VWIN regional average median for orthophosphate is 0.04 mg/L, and the pristine average median is 0.02 mg/L.
Total Phosphorous concentrations for Lake Glenville were all less than 0.02mg/L on 9/14/2021.
Nitrogen
Ammonia-Nitrogen (NH4 +/NH3) is produced by the decomposition of dead plants and animals. The normal ambient level is approximately 0.10 mg/L, and elevated levels of NH3 can be toxic to fish. Although the actual toxicity depends on the pH of the water, the ambient standard to protect trout waters is 1.0 mg/L in summer and 2.0 mg/L in winter. The Volunteer Water Information Network (VWIN) regional average median for ammonia is 0.08 mg/L, and the pristine average median is 0.03 mg/L. The most probable sources of ammonia nitrogen are agricultural runoff, livestock farming, septic drainage, and sewage treatment plant discharges. In WNC, streams with extensive trout farming may also show elevated ammonia-nitrogen concentrations.
Ammonia-Nitrogen concentrations at Lake Glenville ranged from 0.03 mg/L to 0.06 mg/L on 9/14/2021.
Nitrate/Nitrite-Nitrogen (NO3 -/NO2 -) serves as an algal nutrient contributing to excessive stream and reservoir algal growth. Nitrate is highly toxic to infants and the unborn when ingested, causing inhibition of oxygen transfer in the blood stream at high doses. This is the basis for the 10 mg/L national drinking water standard. The ambient standard to protect aquatic ecosystems is 10 mg/L as well. The VWIN regional average median for nitrate/nitrite-nitrogen is 0.5 mg/L, and the pristine average median is 0.2 mg/L. The most probable sources are septic drainage and fertilizer runoff from agricultural land and domestic lawns. Nitrates from land sources end up in streams more quickly than other nutrients such as phosphorus because they dissolve in water more readily and can travel with ground water into streams. Consequently, nitrates are a good indicator of sources of pollution from sewage or animal waste during dry weather.
Nitrate/Nitrite-Nitrogen (NO3 -/NO2 -) serves as an algal nutrient contributing to excessive stream and reservoir algal growth. Nitrate is highly toxic to infants and the unborn when ingested, causing inhibition of oxygen transfer in the blood stream at high doses. This is the basis for the 10 mg/L national drinking water standard. The ambient standard to protect aquatic ecosystems is 10 mg/L as well. The VWIN regional average median for nitrate/nitrite-nitrogen is 0.5 mg/L, and the pristine average median is 0.2 mg/L. The most probable sources are septic drainage and fertilizer runoff from agricultural land and domestic lawns. Nitrates from land sources end up in streams more quickly than other nutrients such as phosphorus because they dissolve in water more readily and can travel with ground water into streams. Consequently, nitrates are a good indicator of sources of pollution from sewage or animal waste during dry weather.
Nitrate/Nitrite-Nitrogen concentrations at Lake Glenville ranged from 0.1 mg/L to 0.2 mg/L on 9/14/2021.
Dissolved Oxygen
Biological activity peaks during the spring and summer when photosynthetic activity is driven by high solar radiation. Furthermore, during the summer most lakes in temperate climates are stratified. The combination of thermal stratification and biological activity causes characteristic patterns in water chemistry. The figure below shows the typical seasonal changes in dissolved oxygen (DO) and temperature. The top scale in each graph is oxygen levels in mg O2/L. The bottom scale is temperature in degrees Celsius. In the spring and fall, both oligotrophic and eutrophic lakes tend to have uniform, well-mixed conditions throughout the water column. During summer stratification, the conditions in each layer diverge.
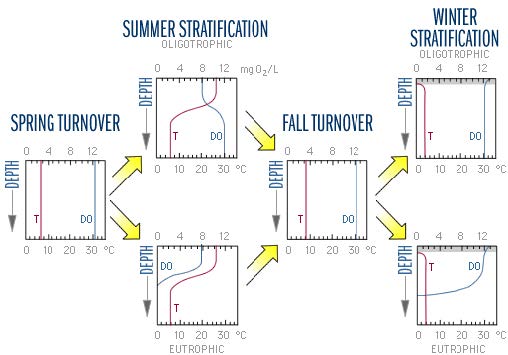
Figure adapted from Figure 8-1 in Wetzel, R.G. 1975. Limnology.
The DO concentration in the epilimnion remains high throughout the summer because of photosynthesis and diffusion from the atmosphere. In oligotrophic lakes, low algal biomass allows deeper light penetration and less decomposition. Algae are able to grow relatively deeper in the water column and less oxygen is consumed by decomposition. The DO concentrations may therefore increase with depth below the thermocline where colder water is "carrying" higher DO leftover from spring mixing (recall that oxygen is more soluble in colder water). These differences between eutrophic and oligotrophic lakes tend to disappear with fall turnover.
In the winter, oligotrophic lakes generally have uniform conditions. Low DO in the water overlying the sediments can exacerbate water quality deterioration, because when the DO level drops below 1 mg O2/L chemical processes at the sediment-water interface frequently cause release of phosphorus from the sediments into the water. When a lake mixes in the spring, this new phosphorus and ammonium that has built up in the bottom water fuels increased algal growth.
The dissolved oxygen (DO) criterion for trout waters is not less than 6.0 mg/L. Dissolved Oxygen concentrations in Lake Glenville ranged from 8.3 mg/L to 8.6 mg/L on 9/14/2021 meaning the waters have abundant oxygen to support trout and other fish species.
Conductivity
Conductivity is measured in microsiemens per centimeter (μS/cm) and is used to measure the ability of a water sample to conduct an electrical current. While pure water will not conduct an electrical current, samples containing dissolved solids and salts will form positively and negatively charged ions that will. The concentration of dissolved ions in a sample determines conductivity. Inorganic dissolved solids such as chloride, nitrate, sulfate, phosphate, sodium, magnesium, calcium, iron, and aluminum affect conductivity levels. Geology of an area can affect conductivity levels. Streams that run through areas with granitic bedrock tend to have lower conductivity because granitic rock is composed of materials that do not ionize in water. Streams that receive large amounts of runoff containing clay particles generally have higher conductivity because of the presence of materials in clay that ionize more readily in water. The VWIN regional average median for conductivity is 69.8 μS/cm, and the pristine average median is 19.0 μS/cm.
Conductivity of the water in Lake Glenville ranged from 18 μS/cm to 19 μS/cm on 9/14/2021.
Blue Green Algae Phycocyanin and Chlorophyll-a
A diverse population of algae is usually beneficial and provides a rich food source for aquatic animals. However, when hot temperatures and calm water combine with nutrient-rich waters, large algal blooms may form that can produce toxins that pose a human health hazard. Microcystins are a class of toxins produced by certain blue-green algae. Phycocyanin and chlorophyll-a are pigments found in algae. Phycocyanin and chlorophyll-a are tested in lakes to determine how much algae is in the lake. Algae is important in lakes because it adds oxygen to the water as a by-product of photosynthesis. On the other hand, if there is too much algae in a lake it can produce a foul odor and be unpleasant, or unsafe, for swimming. Chlorophyll-a concentration can tell you a lot about the lake’s water quality and trophic state. We can compare annual mean phycocyanin and chlorophyll-a values to see if the amount of algae in the lake per year is increasing, decreasing, or staying the same.
In this case, the instrumentation used to detect phycocyanin and chlorophyll-a does not determine the actual concentration of algae, but rather produces a value used as a proxy for actual concentrations.
Despite not being able to determine concentrations, in general, the phycocyanin and chlorophyll-a values measured in the water at Lake Glenville indicate that algae concentrations were low at the time of sampling and would not pose any threat to recreational use.